


Senedd committees are an important part of Welsh democracy. They hold the Welsh Government to account for their actions and spending, scrutinise draft laws, and engage directly with citizens.
Committees rely on evidence from a range of people and organisations to do their work. This helps them to decide which issues to investigate, where problems are, and what solutions might work. The more evidence gathered from different perspectives, the better the committee’s understanding of an issue.
Why do committees monitor the diversity of the evidence they gather?
Since 2021 Senedd committees have collected data about the people and groups that contribute written evidence, provide oral evidence at committee sessions, and participate in citizen engagement work.
This provides an insight into who is involved in committees’ work. It also helps identify missing voices and highlights barriers to engagement. The data is collected through a voluntary survey sent to everyone participating in committee work.
You can read more about the pilot project and the results from pilot 1 in last year’s article.
This article summarises the main findings of the data gathered in pilot 2, between September 2022 and April 2023.
What does the committee evidence diversity data tell us?
- The survey response rate increased significantly, from 18% in pilot 1 to 41% in pilot 2 (which equates to 369 responses).
- The majority of individual respondents (around 60%) and organisations (around 80%) had participated in committee work before.
- 74% of respondents participated in committee work on behalf of an organisation, 19% in a professional capacity, and 7% in a personal capacity.
- The responses indicate a large drop in remote participation – from 89% of respondents in pilot 1 (some of which was during COVID restrictions) to 41% in pilot 2.
- An increasing proportion of people participated in English only (from 75% in pilot 1 to 90% in pilot 2).
Sectoral representation
The following graph shows the share of survey responses for each sector and highlights differences with the SBMS data.
Survey responses by sector (click on a bullet point or block on the graph)
|
■ 26% of survey respondents participating in a professional capacity or on behalf of an organisation said they represented the public sector – a decrease from 33% in pilot 1. ■ The third/voluntary sector remains well represented, at 30% of respondents. ■ Professional bodies and trade unions represented 14% of the survey responses – an increase from 8% in pilot 1. ■ 11% of respondents were from the academic/research sector, which is an increase from 8% in pilot 1. Around half of these respondents had never previously participated in the work of committees. ■ Private sector participation in committee work remains low, representing under 5% of survey respondents (the same as in pilot 1). As a reference point, 69% of the Welsh workforce is employed in the private sector. ■ Under 20% of evidence came from other sources including: Ministers or officials from other national or devolved governments; Senedd Cymru Members, their support staff or Commission staff; industry bodies or regulators; campaign or community groups; representatives of youth groups, school pupils, students, or Members of the Welsh Youth Parliament. |
|---|
Figures are rounded. Values under 5% are not shown for disclosure control. Box sizes are approximate for the private sector and other sources groups.
Geographic representation
The graph below shows the percentage of survey respondents by area of residence. Comparison with the percentage of the Wales population indicates whether areas are over or under represented.
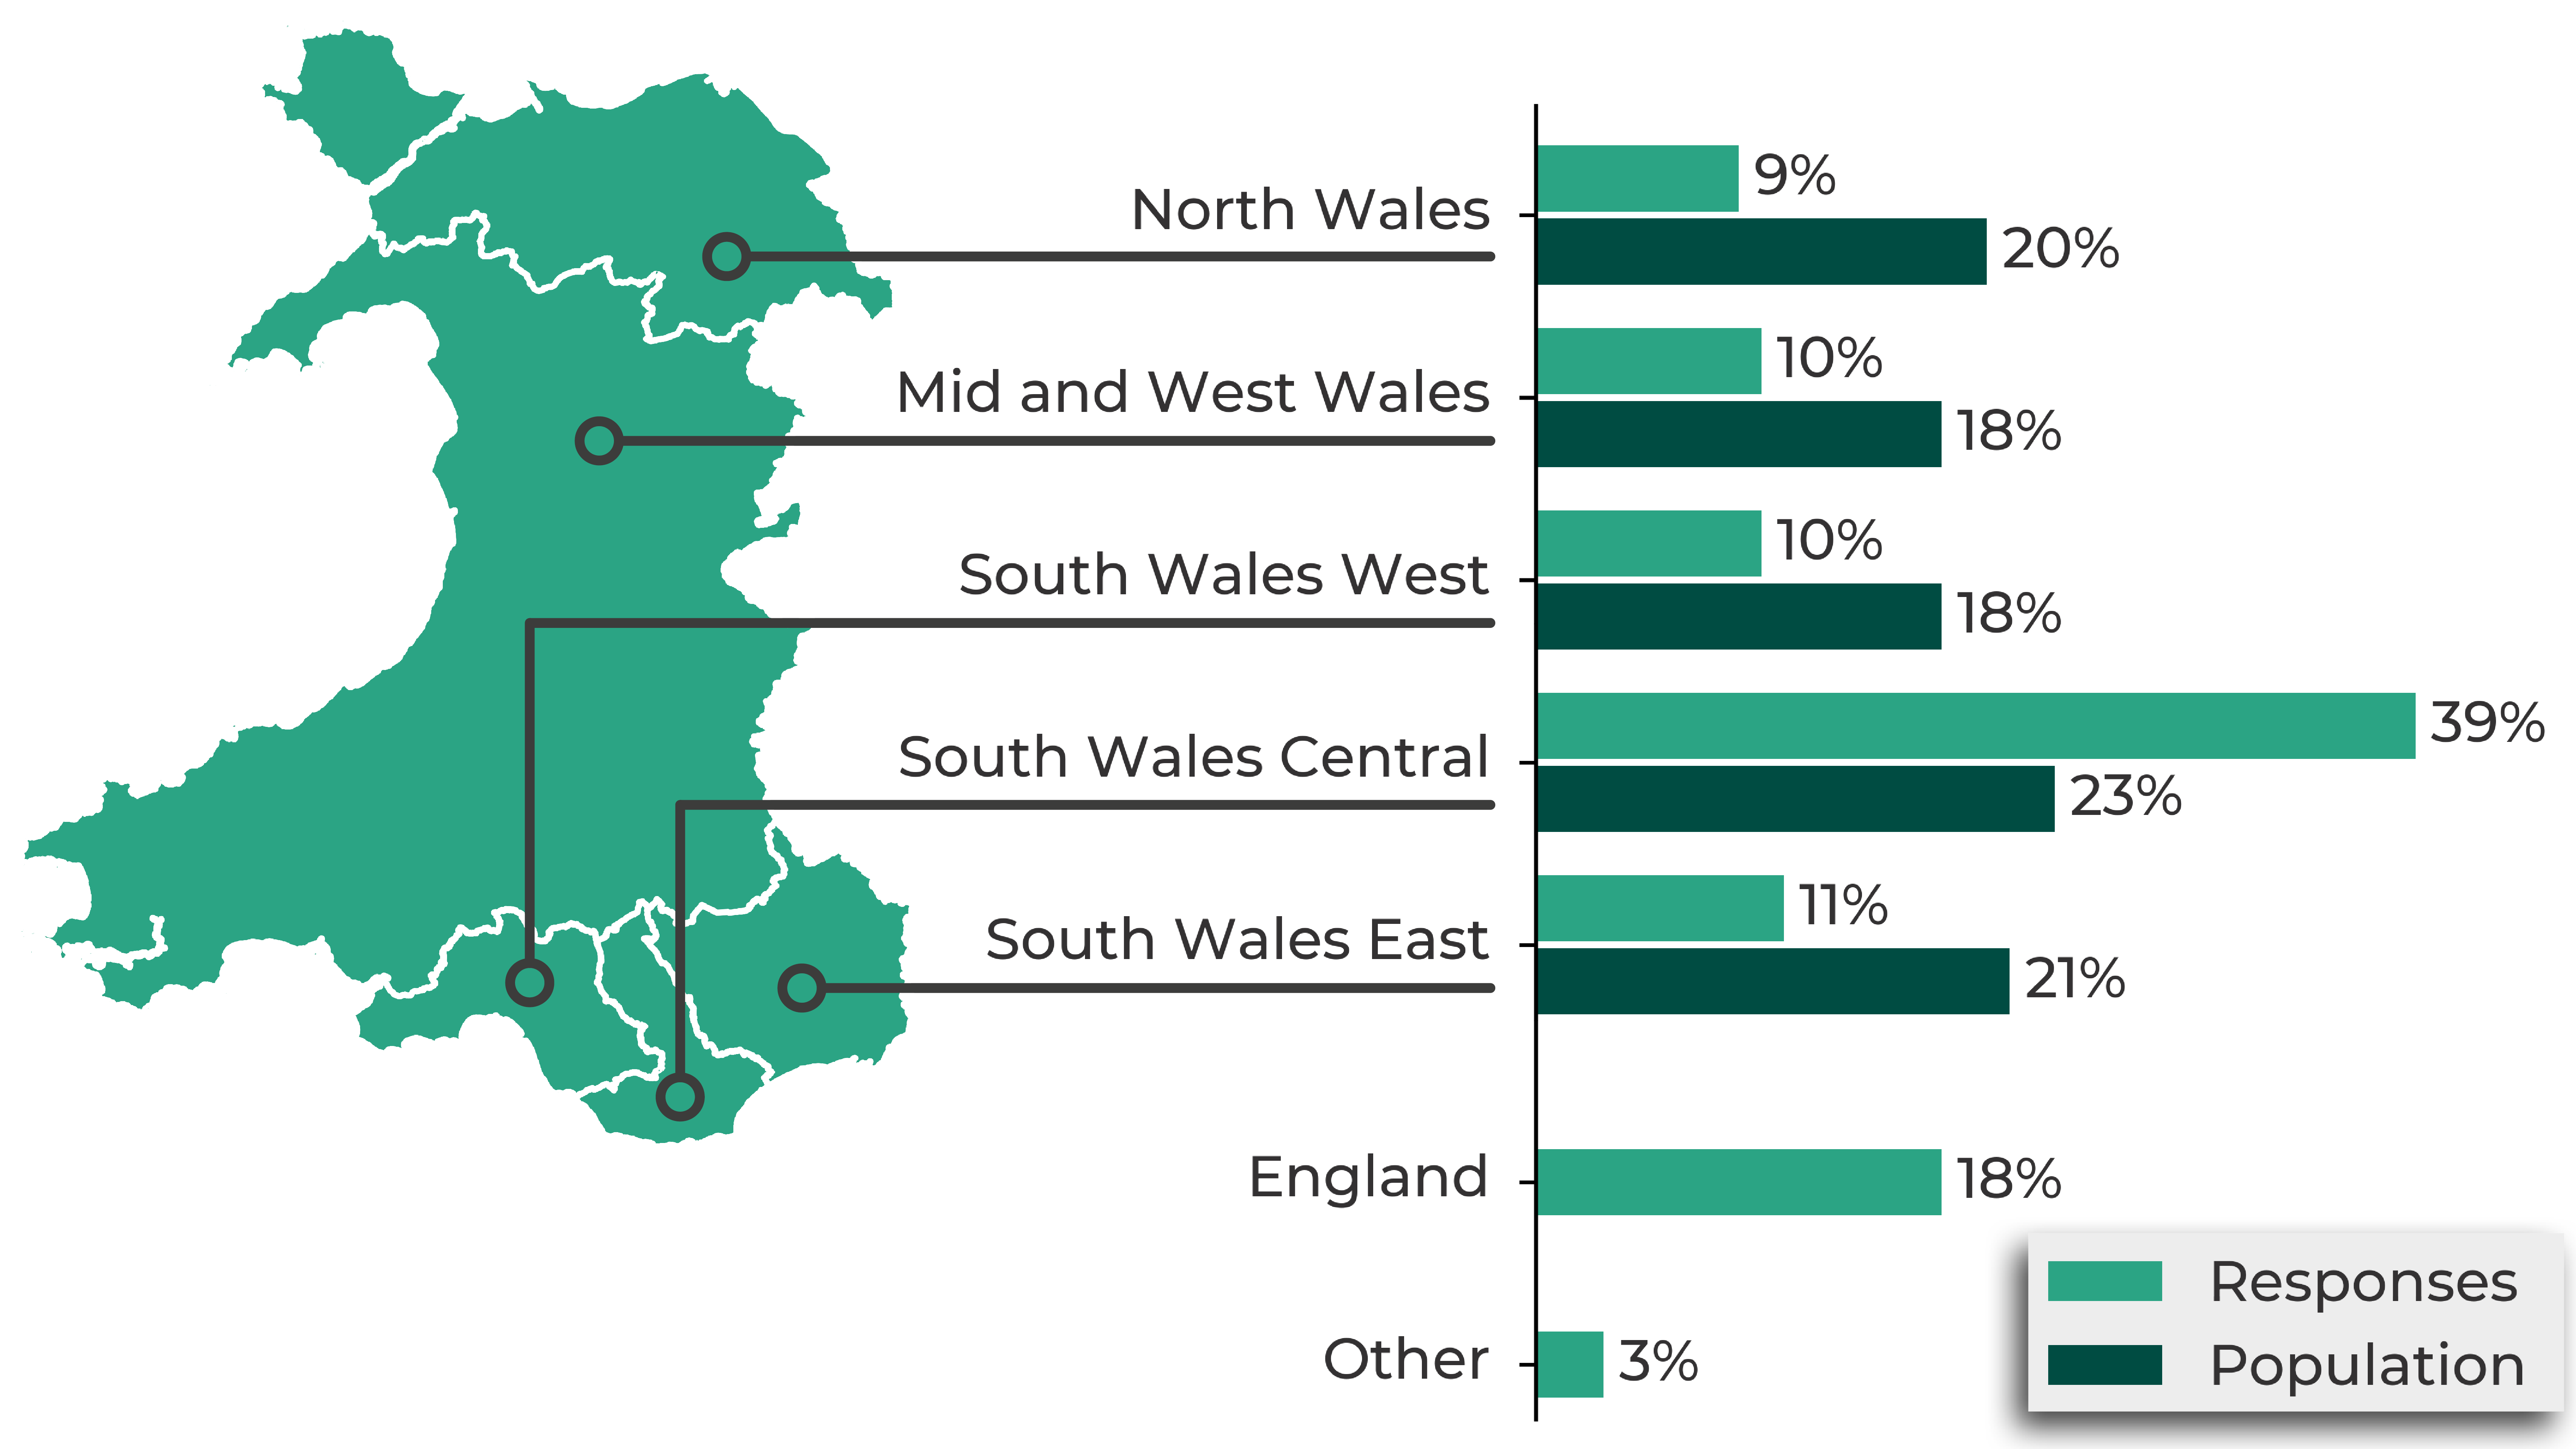
Source: Data for the Senedd Cymru constituency areas: 2021.
'Other' includes Scotland, Northern Ireland, outside the UK, or preferred not to say.
Demographic representation
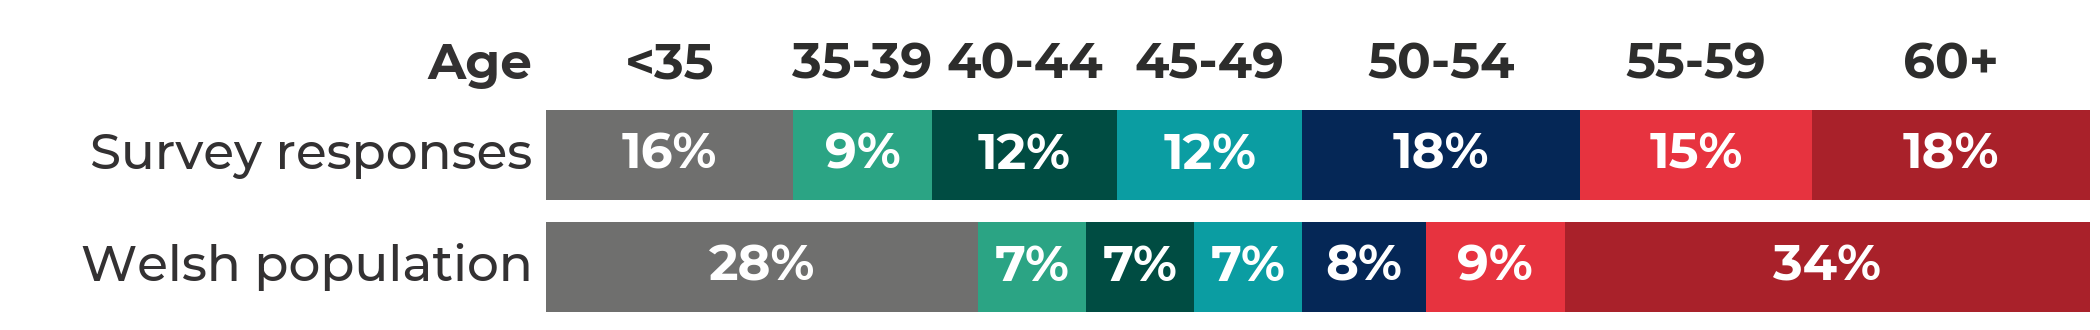
- Compared with Welsh Census 2021 data, the survey data showed an over-representation of people aged 35-59
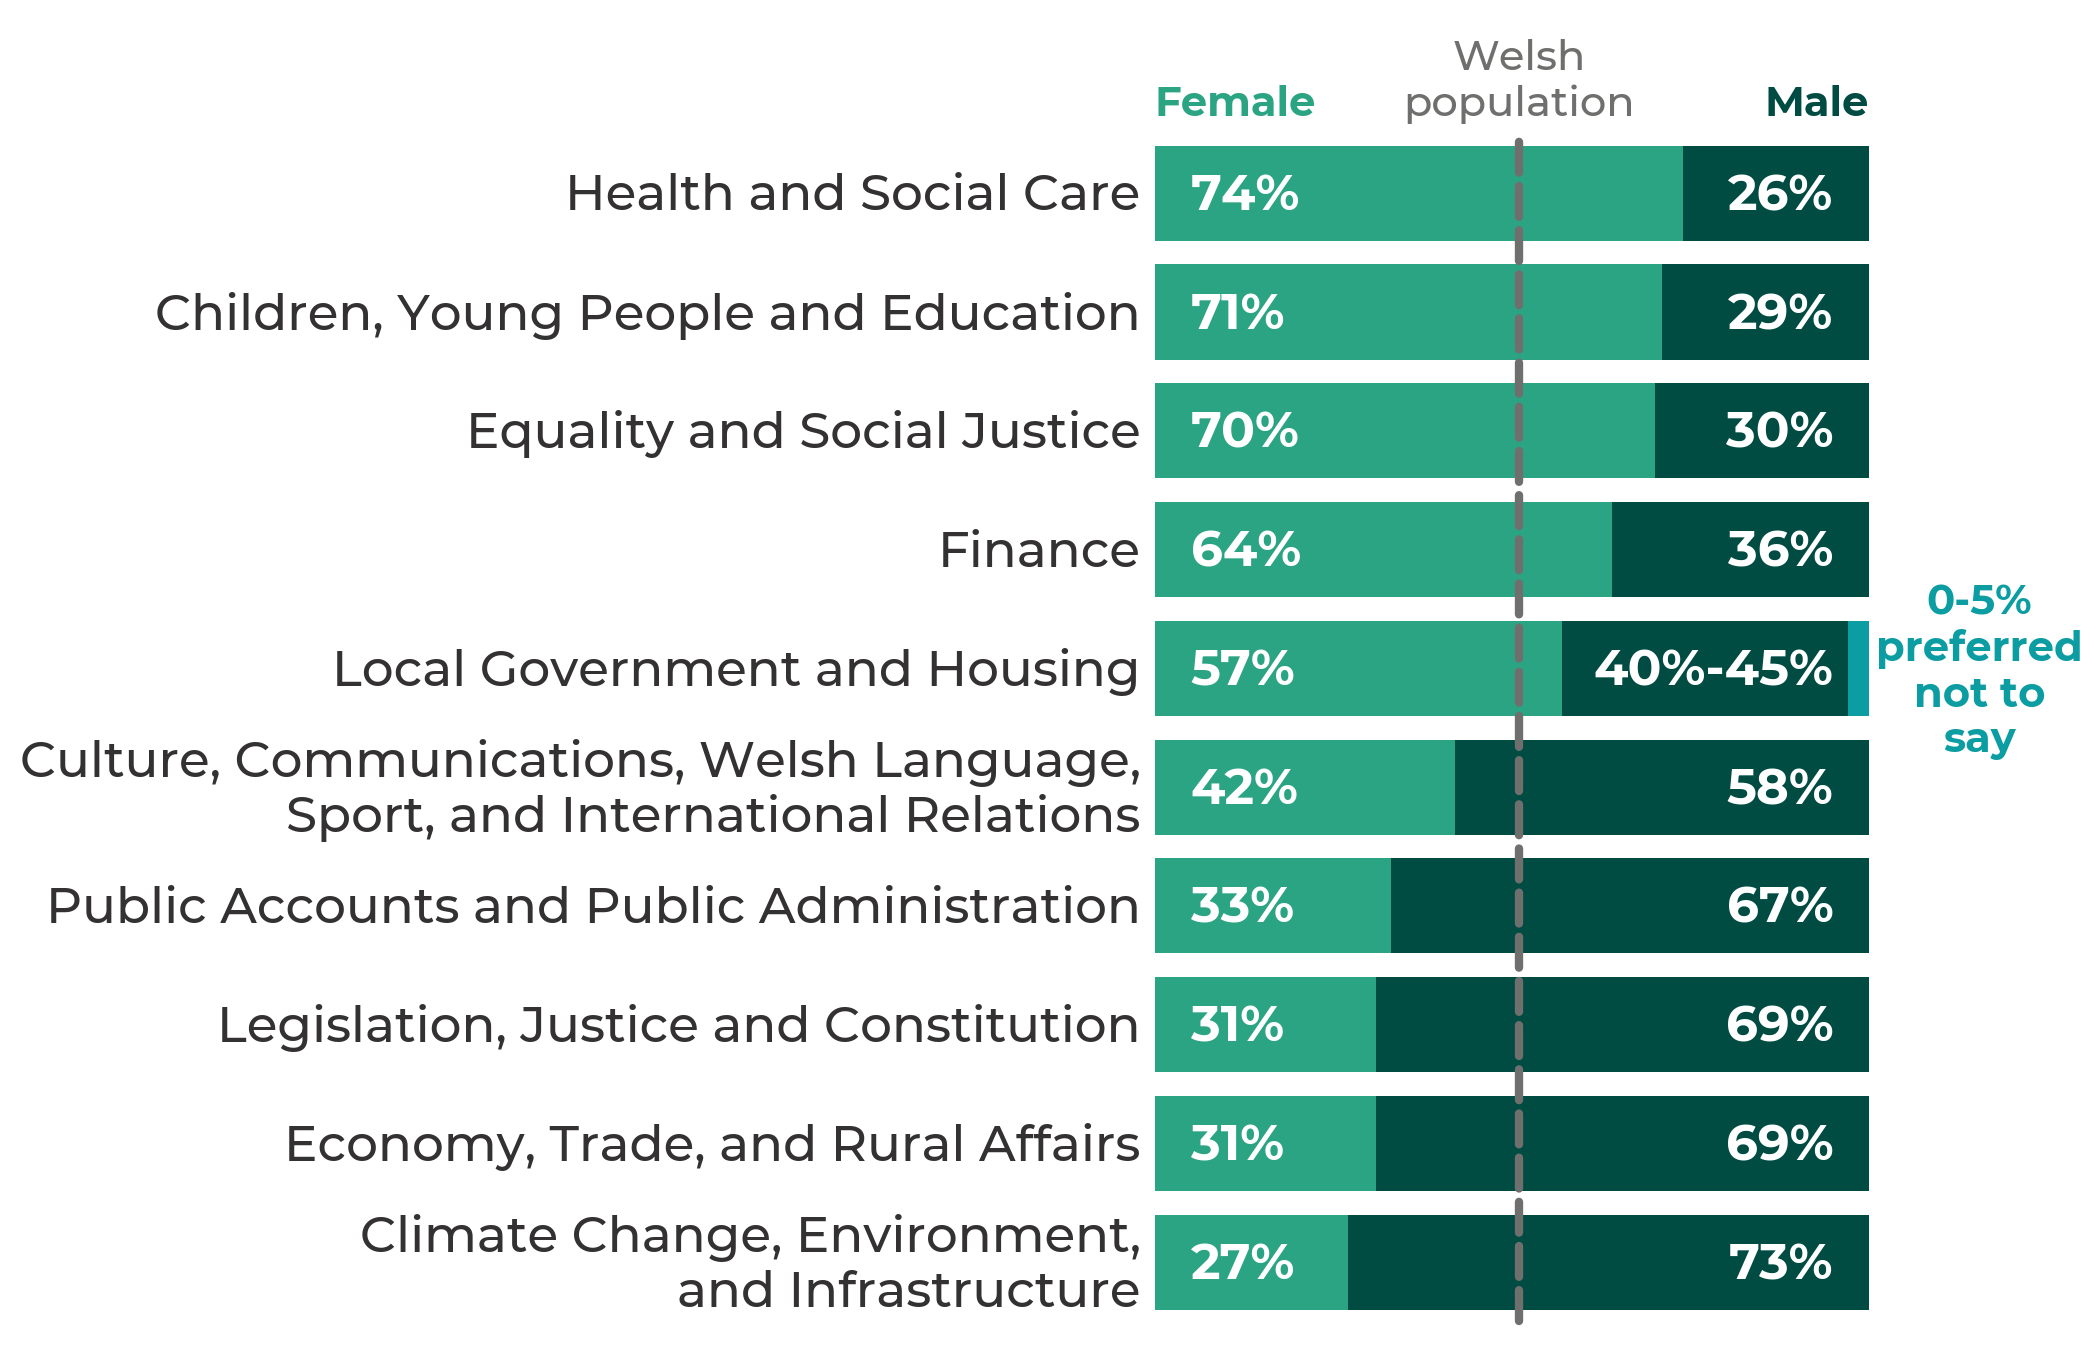
- 55% of respondents identified as female, compared with 51% of the Welsh population. However, there were variations by committee.
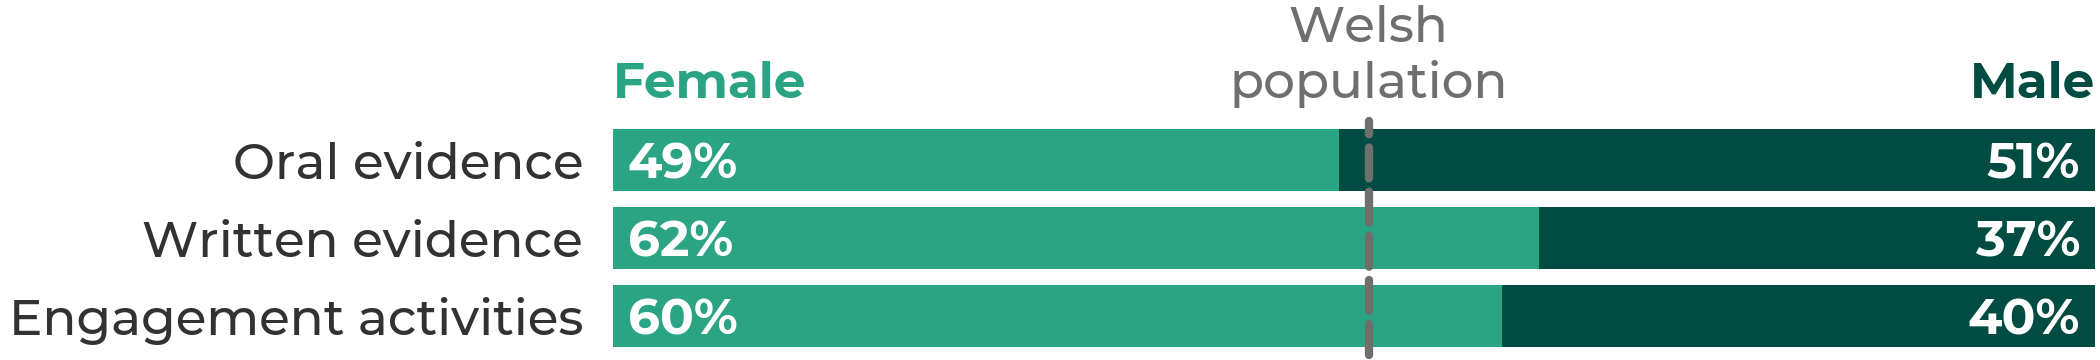
In addition, females were roughly equally as likely as males to contribute oral evidence but were over-represented in written evidence and in engagement activities.
- No respondents identified as trans, compared to 0.4% of the Welsh population.
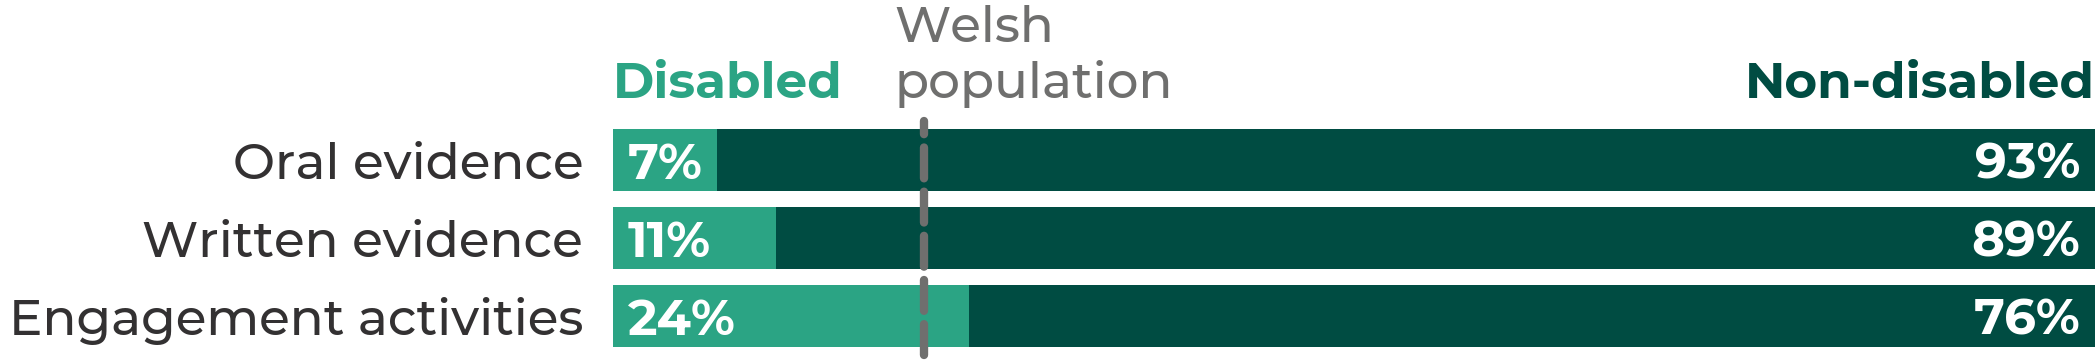
- 12% of respondents had a disability, compared with 21% of the population.
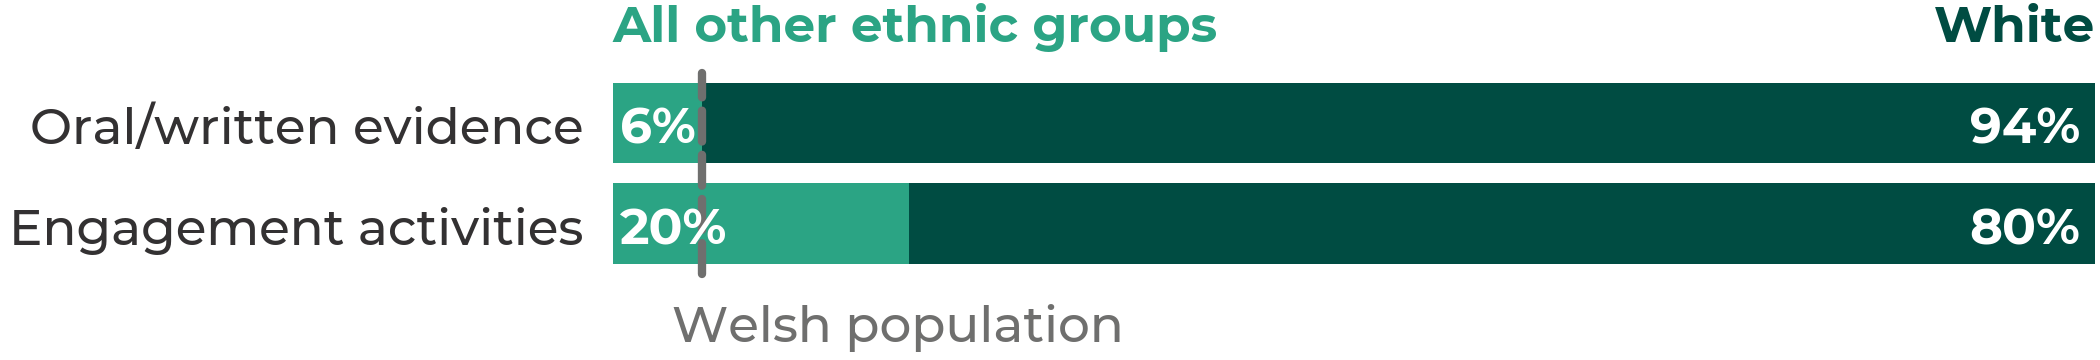
- 92% of respondents described their ethnic group as ‘White’, compared to 94% of the population. Respondents describing their ethnic group as Asian, Asian Welsh, or Asian British made up 3% (in line with the population), and other ethnic groups (including Mixed or Multiple ethnic groups, Black, Black Welsh, Black British, Caribbean, or African, and other ethnic groups) made up 0-5% each.
- 49% of respondents described their national identity as Welsh or Welsh and British, compared with 63% of the population.
- More than half (56%) of respondents stated that they had no religion (compared to 47% of the population), and 41% were Christian. 0-5% (each) were Muslim, Hindu, Buddhist, Sikh, and other religions.
- 88% of respondents described themselves as heterosexual/straight, compared with 89% of the population. 5% of respondents described themselves as gay or lesbian (compared with 2% of the population), and 5% as bisexual (compared to 1% of the population).
- 84% of survey respondents said they did not have caring responsibilities for someone because of long-term health conditions, illnesses, or problems with old age (a slight increase from 80% in pilot 1), compared with 90% of the population.
- Those educated to degree level or above remain overrepresented at 95% of respondents, compared to 32% of the population. Those employed full time, part time, casually, or irregularly) are also overrepresented at 88% of respondents, compared to 54% of the population.
- 20% of respondents considered themselves to be from a disadvantaged background, an increase from 15-20% in pilot 1. Of the respondents who took part in engagement activities/visits, 30-35% were from a disadvantaged background (compared to 19% of those providing written evidence and just 17% of people giving oral evidence).
The experience of giving evidence
- Most respondents (91%) said they were satisfied or very satisfied with their experience of participating in committee work. 84% said that given the chance, it was ‘very likely’ that they would take part in committee work again, an increase from 76% in pilot 1.
What next?
On 3 July, the Chairs’ Forum decided to mainstream committee evidence diversity monitoring for the rest of this Senedd. Committees are also undertaking work to improve guidance about participating in their work and developing new training for staff who support committees.
You can read more about the pilot in the FAQs.
- Data relating to fewer than ten responses has been obfuscated, and a data range is shown instead.
- Comparisons with pilot 1 should be treated with caution as the data is not directly comparable.
- 89% of respondents indicated that they were happy to be asked questions about themselves, so the demographic representation section is only based on those responses. It also excludes those who chose not to answer individual questions or who answered 'prefer not to say'.
- Figures are rounded.
Article by Hannah Johnson, Claire Thomas and Joe Wilkes, Senedd Research, Welsh Parliament
